Modern Operating Systems: Book Review

Dear Reader,

I decided to write a quick review for a book I read through while taking a Operating Systems course at Harvard Extension.  I’m currently re-reading through it and found it really useful.
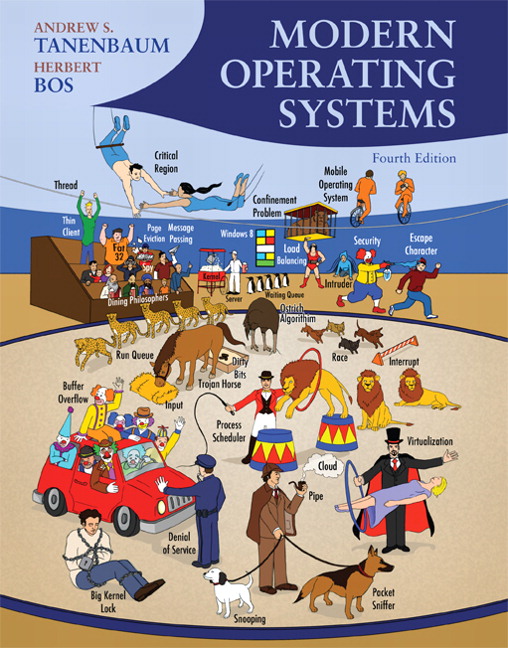
Modern Operating Systems goes through basic components of a computer and talks about how the operating system interacts with it. Topics covered:

  1. Processes, CPU and Scheduling.
  2. Memory and Paging.
  3. File System and I/O devices.  I/O section is split into block and character devices with smaller sub-sections on clocks.
  4. Deadlocks and algorithms to resolve them.
  5. Virtual Machines and Security.
  6. Examples of Operating Systems: Android, Windows and Linux.

Currently about 50% through the book.  The book covers gets pretty detailed.  Topics in the book that I found really interesting:

  1. Scheduling algorithms and how processes are swapped out by the CPU.
  2. Mutex/Semaphores and the concept of locking a resource.
  3. Different levels of caching involved in CPU, memory and file-system.
  4. How memory, virtual memory and swapping works.
  5. I/O devices: it gets into the details of a hard disk and breaks down what determines seek time.

I plan on getting through at least 20-30% more of the book as it provides some extra context for my job.  I spend a lot of time working with virtual machines (AWS) and have to look for problems like a pegged CPU or high-levels of memory consumption.  Understanding what happens under the covers from a operating system perspective is useful.

Best,

Chris


Introduction to Python – Class 7 – Functions

Dear Reader,

This is the 8th week of classes that I have taught at the CIC for health innovators, a health incubator/accelerator.  There are currently 3 lessons remaining for the series to be completed.

Last class, we covered basic concept of functions:

Class Slides 7

Class Code 7

In the class, we start with a very basic function with no return statement or parameters.  We then add more “features” to the function.  We begin with return statements, then go through different types of parameters and end with a discussion of variable scope.  Variable scope explores how variables interact with functions.  The last topic covered is import statements and packages.  We get into a discussion of how pip works and what PyPI is.

I didn’t cover the advanced section of the course, which goes over lambdas, decorators, recursion, memoization and closures.  Class 8 will cover these subjects and then go through 2 examples: 1. Medical Records processing example and 2. CLI builder tool called “Click”, which extensively uses decorators.  The later two projects will be considered part of Class 8.

I really wanted to get into some of Peter Norvig’s work.  Since I didn’t cover it in class, I will add it as suggested article below:

Peter Norvig’s Sudoku


Best,

Chris


Monitor: Graphite, Collectd, Statsd and Graphana

Dear Reader,

Need to monitor many computers at the same time? Are you worried about a pegged CPU, memory paging, lots of swap space activity or low disk space? What about high network traffic? These things are readily available on Amazon through AWS CloudWatch.

I decided to implement 1 of 2 major monitoring stacks. The first stack is: Logstash, Elasticsearch and Kibana (ELK stack). The second group of technologies is: Collectd/Statsd, Carbon/Whisper and Graphite/Graphana.  I implemented the later.

My pre-mature conclusion is:

  1. ELK stack: Is great for text heavy documents.  Elastic Search is based on Lucene, a popular open-source search engine.
  2. Graphana/Carbon: is great for time series analysis with an emphasis on near realtime data feeds.  Collectd provides a convenient plugin/interface to operating system statistics.

Below is the Front-end component monitoring the monitoring computer (not WordPress):

Graphana Server

Graphana Server


The components of the system are:

  1. Collectd – data collection software with a plugin architecture.  Common plugins seen above include: CPU, Memory, Disk Usage, Processes, Network Traffic, Apache metrics and much more.
  2. Statsd – Used more for application monitoring.  You can send custom metrics based on set intervals.  The common 4 metrics I saw: gauges, counts, sets and intervals.  The first one takes the last of measurement within an interval and reports it.  Counts aggregate data over 10 seconds.  Sets return a unique count of values encountered (via UDP).  Intervals are time-based calculations (like rates).
  3. Carbon/Whisper – A data store focused on time series aggregation.  Data is aggregated based on two configuration files.  The first sets up regex matches (used to categorize TCP traffic) followed by a data retention policies as well as specifying polling time-frames (typically in seconds or minutes).  The second file specifies the type of aggregations available: sum, min, and max.
  4. Graphite/Graphana – Graphite is a front-end dashboard tool for carbon.   Graphana serves a similar role, but with a sleek black UI (featured above).  Both are similar to Kibana.  They both provided dashboard and graphing utilities to their respective data stores.  With Graphana being able to access other sources (like ElasticSearch).

For my Graphana localhost dashboard, I used CPU, Memory, DF and Processes modules from Collectd.

If interested in trying out the service, I can recommend the following 4 articles (Ubuntu):

digital ocean: metric tracking tutorial

For Graphana, you have to follow these instructions:

Graphana Install

Best,

Chris


Interactive Programming Diagrams

Python Tutors

Introduction:

Philip J. Guo is a professor of Cognitive Science at UC San Diego, who focuses on teaching programming at interactively online.  He has produced great products for both programming beginners and those interested in Python internals (10-hour lecture).

He impressed me with Python Tutors website: python tutors. Python Tutors is: Python, Java, JavaScript, TypeScript, Ruby, C and C++.  Python tutors converts Python written on the left into data structures on the right.  This provides a deeper view of what Python is actually doing.  The diagrams are step-based, which means you can see the execution of each line of code and what happens beneath the covers.  Red and Green arrows show you the line to be executed and the line being executed.  An example below.

Example (click image to go to interactive page):


Related Posts:

introduction to python – health innovators class

great python books – beginner to intermediate

Happy Holidays,

Chris

Statistics and Machine Learning Visualizations

Visually Explained

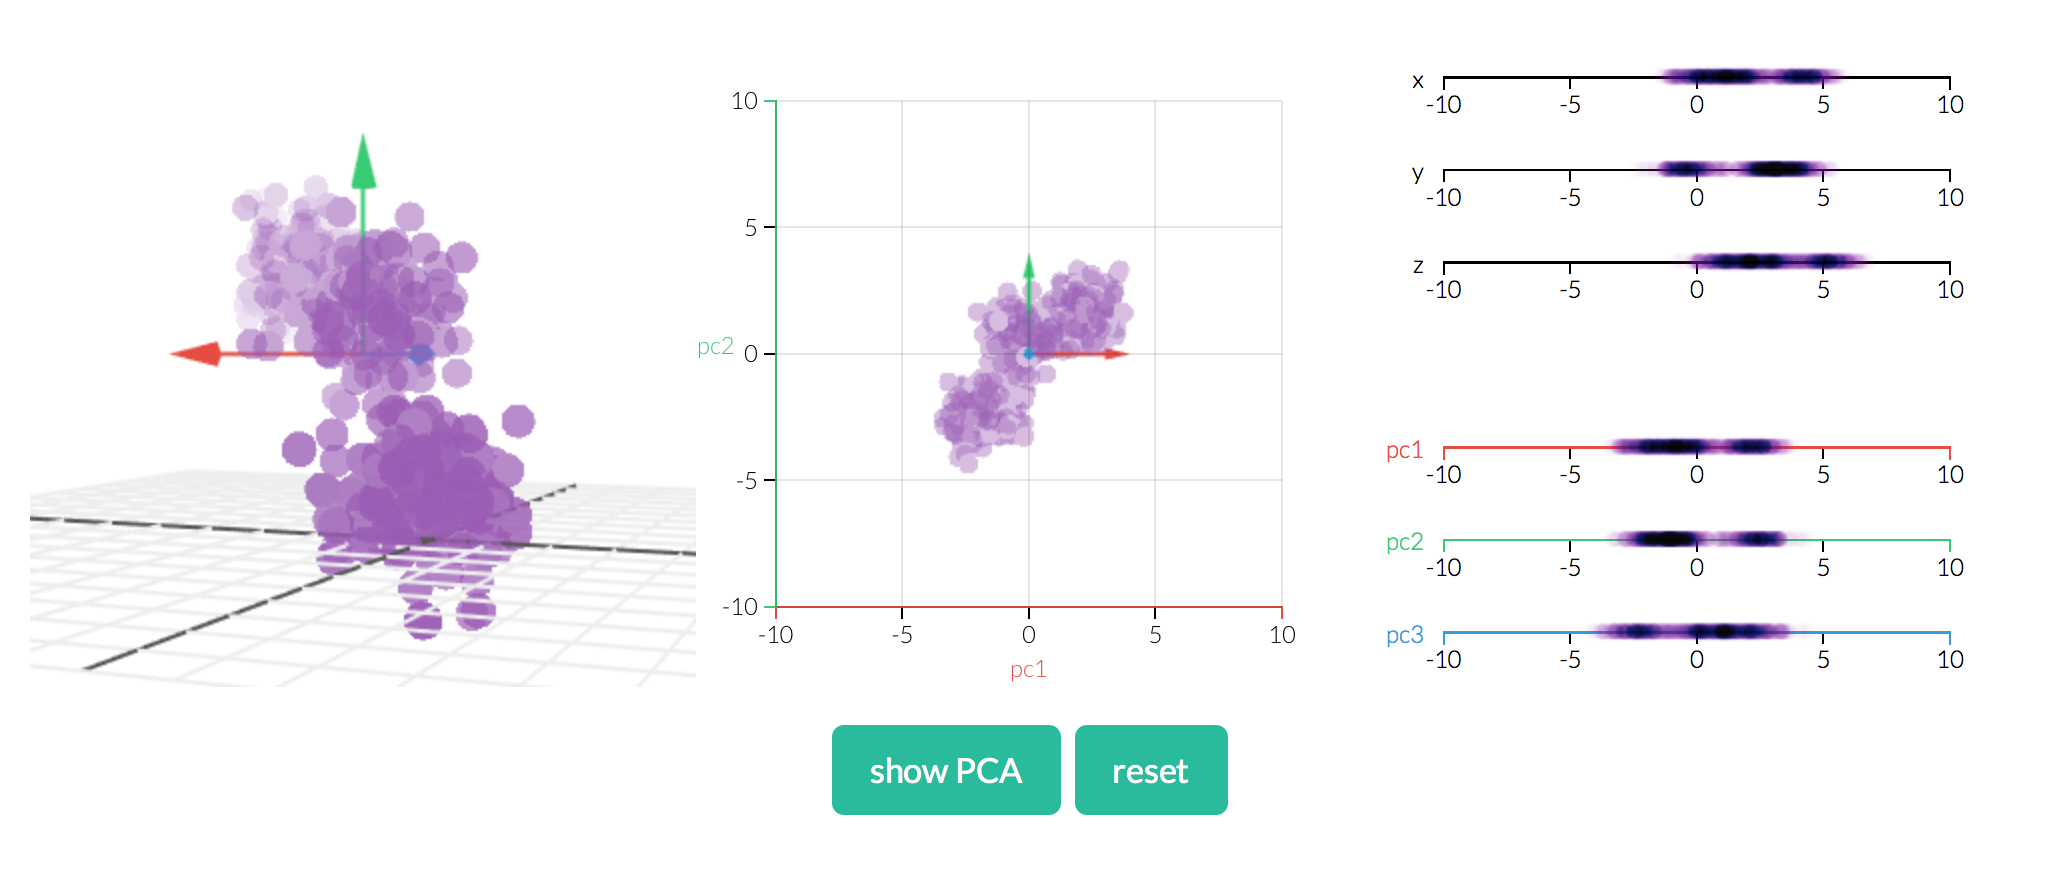
At work, a software engineer provided a link to interactive data visualizations.  The visualization shows a statistical model and their fit with data.  The data points can be moved/modified instantly influencing the model.  It’s a fun way of seeing how a model works.

Interactive Data Visualizations: Statistics Models

Example Interactive VisualizationExample Interactive Visualization

The models and concepts available are: PCA, OLS, Conditional probability, Markov Chains, Eigenvectors and Image Kernels.

Chris

Similar Posts:

Machine Learning: Part 1