Fall 2018 – Readings and Online Courses

Dear Reader,

I decided to write quickly about 6 programs/books I took: AI Programming with Python (Udacity), Google Cloud Platform Architecting (Coursera), Creating Kivy Apps by Dusty Philips, Linux Kernel Development by Robert Love, Terraform: Up and Running by Yevgeniy Brikman and the Design of Everyday Things by Donald A. Norman.

Udacity: AI Programming with Python

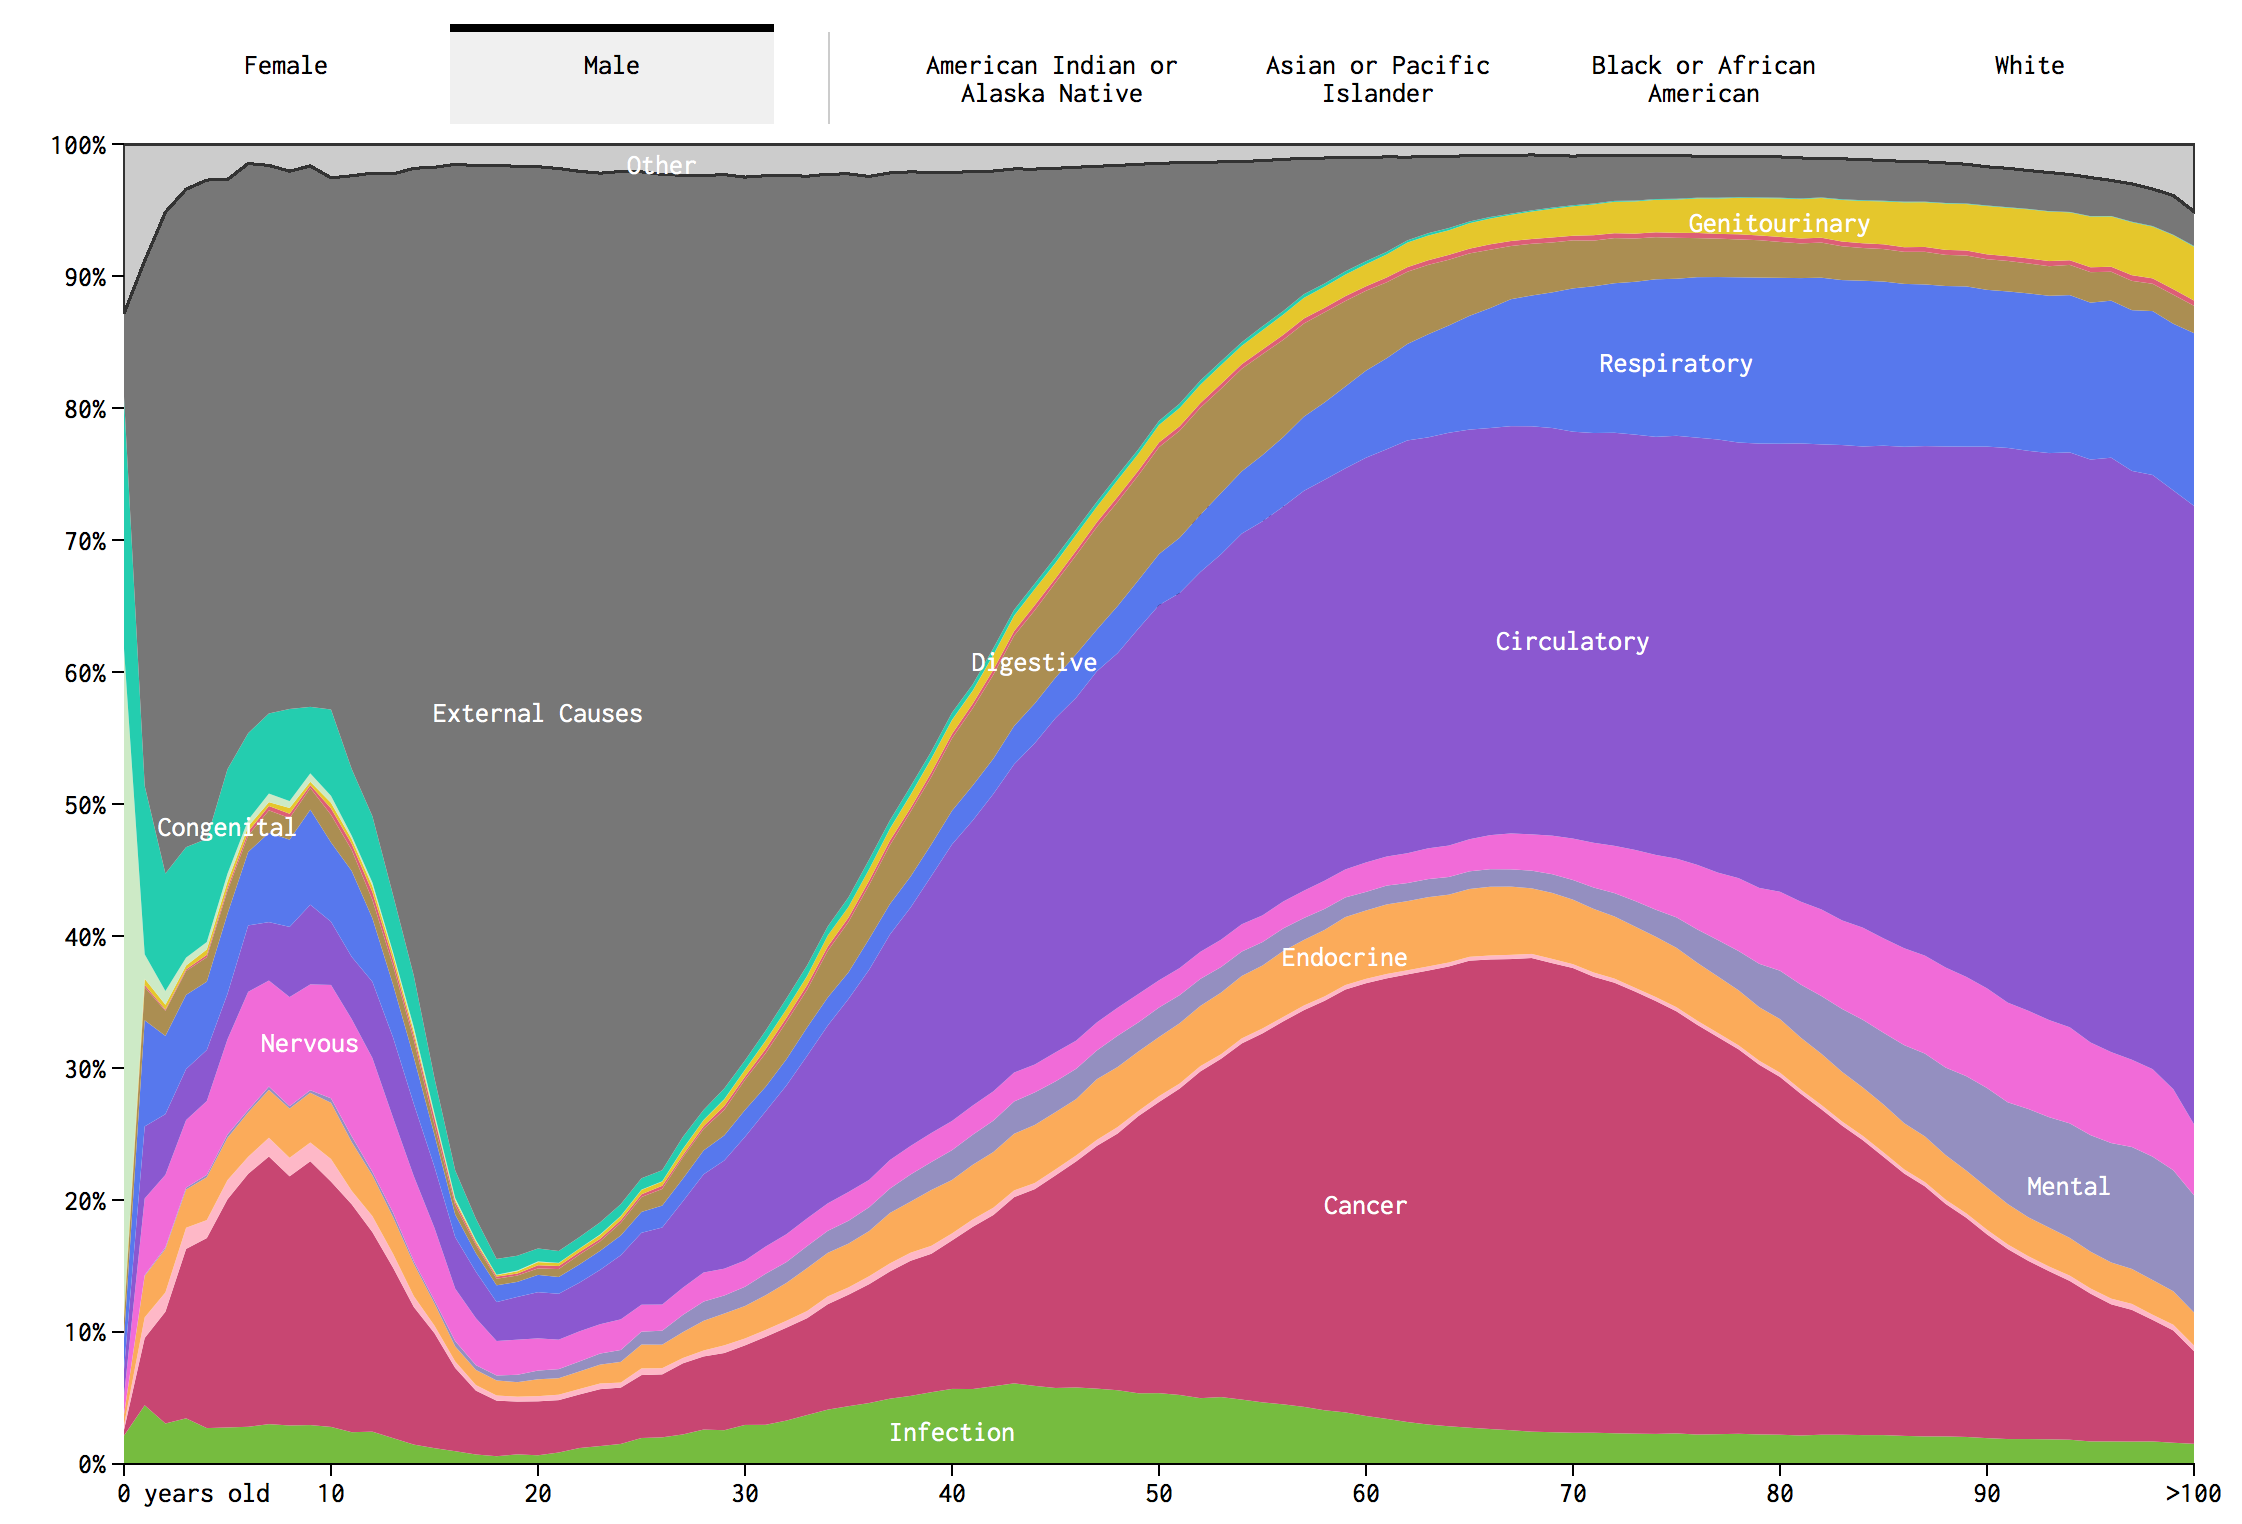
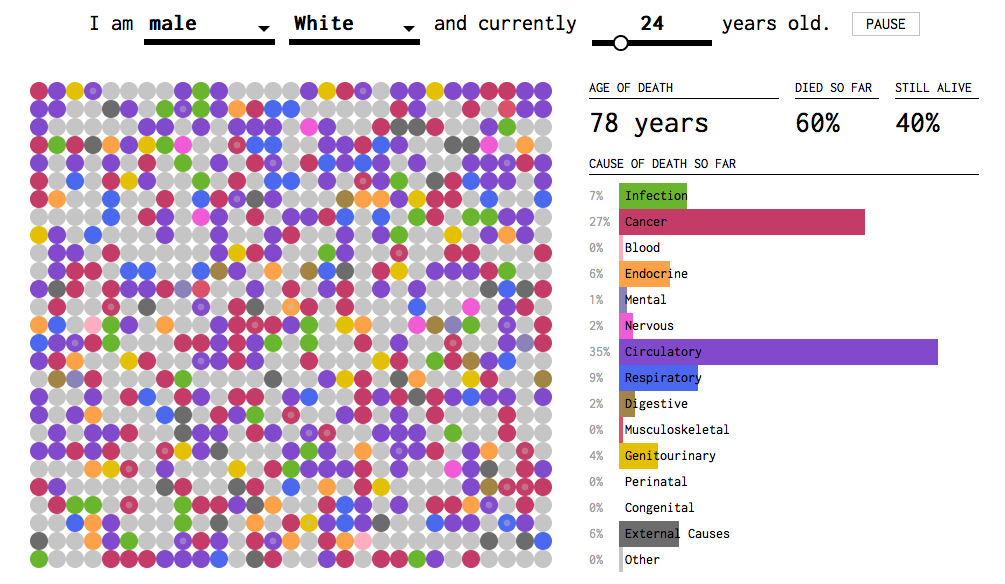
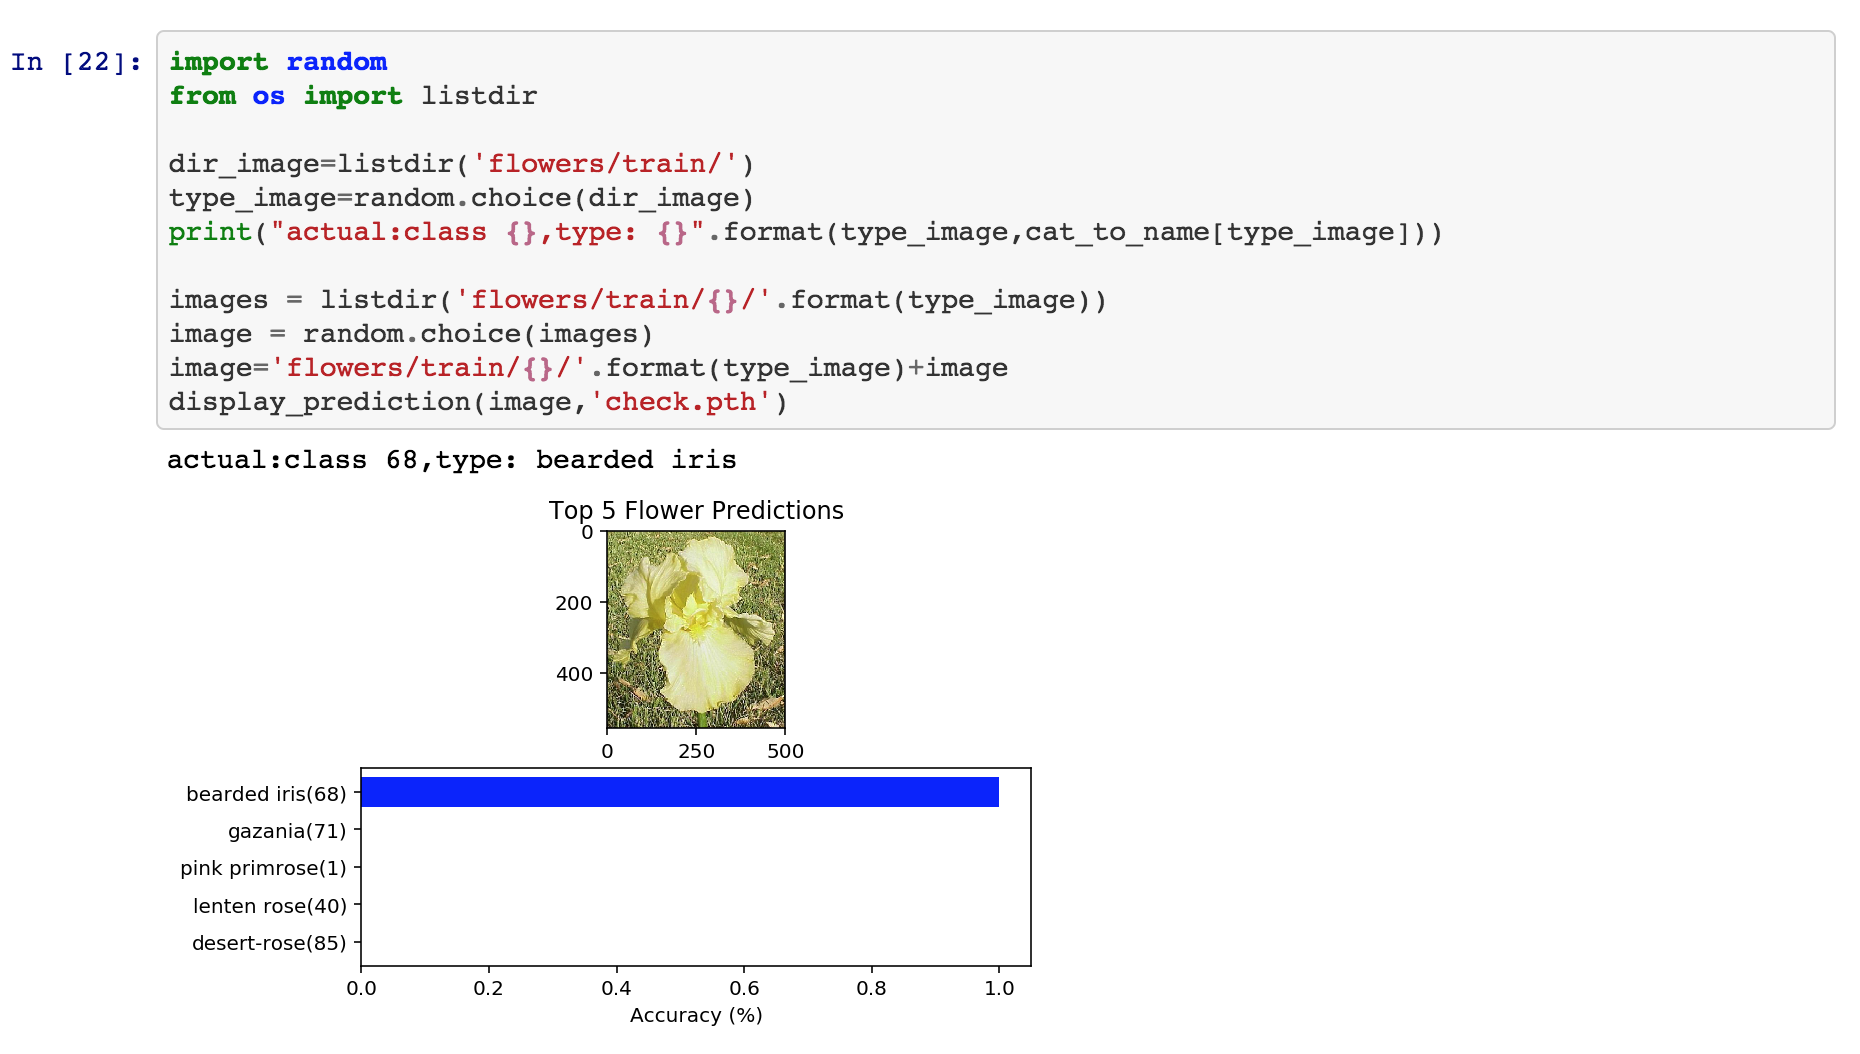
This is the entry-level course in AI for Udacity.  Udacity is an online course-ware provider that focuses on providing content on cutting-edge topics: AI, Deep Learning, Self-driving cars and Node/React.  It also has classes on data analysis and marketing.  AI program starts by teaching you python, brushing up on some linear algebra and finishing off with 4 sections on AI: Two theoretical units on gradient descent and neural networks, one on PyTorch and a final project that classifies flowers.  PyTorch is Facebook’s AI framework built in Python.

AI Class

The course is well prepared overall and should be manageable for someone with intermediate programming skills.  Best in Python.  It’s a bit on the expensive side for online material: $500-$1000, but Udacity tends to make up for the price tag with more interesting content and topics.  Overall the quality is good.  I’ve heard FastAI is a free alternative.

My Repo: https://github.com/Silber8806/udacity-AI-programming-with-python

Coursera: Architecting with Google Cloud Platform

Offered by Google Cloud

Google Cloud Platform, GCP, is googles answer to AWS, Amazon Web Services.  Overall, the platform has many of the same services as Amazon including Cloud Functions, which looks to be AWS Lambda for Google Cloud.  The only glaring issues I’ve noticed so far: 1. No equivalent to SNS for e-mail and some UI issues in the console concerning Google Cloud Storage (S3).  The first part is painful in that Google by default blocks the smtp ports forcing you to use a 3rd party provider (with limited support in stackdriver).

Google outsourced most of it’s training for GCP to coursera.  The courses are broken into 6 parts.  The first course covers all of the services on a 40,000 foot level, 4 courses proceeding this are in-depth technical reviews of virtual machines, networking, storage, database technologies, container services and autoscaling solutions.  It also includes a host of managed services including the very neat sounding: “Spanner”, a supposedly horizontally scaling RDBMS service.

The last course, Reliable Cloud Infrastructure: Design and Process,  was the most interesting.  It provides a practical overview of how to construct infrastructure as well as going over Google’s philosophy on designing scalable software.

Something that really stood out about this program is the labs.  They provide you a temporary Google Cloud Account for your tutorials.  You get to practice on the actual Google console and shell prompts.  This program is reasonably priced at $49.99 per month.  You can take the material without labs for free, but I’d recommend the labs!

Creating Apps in Kivy:

Kivy is Python’s Mobile Application development framework.  It’s used to make cross-platform applications for: Android, IPhone and Ipads.  It’s something I’ve wanted to try out for a while just out of curiosity.  I picked up Creating Apps in Kivy by Dusty Phillips, a book on the subject.

Creating Apps in Kivy

The book covers two applications: A weather application using an open weather api and a video game involving spaceships.  The weather app takes the block of the book with significant amount of time spent on UI and UI interactions.  Kivy generally is split into two files: a main file in python that is event-driven and a .kv file that describes the component layout.  A single chapter is dedicated to graphics.  The best part of the graphics section was developing animated snowflakes that fell from a single component.  The book also covers databases and advanced UI components like a carousel.

Overall, I’m happy with the quality of this book with the exception of 2 things.  It was hard to read the indentation between pages and there were a few chapters where I had to add imports or features he didn’t mention to get the examples to run.  For this reason, I’d recommend being somewhat well versed in Python before attempting the sample projects in the book.

Github Repository: https://github.com/Silber8806/kivy_tutorial

Linux Kernel Development (3rd Edition) by Robert Love:

I started reading this book after my colleague at Salesforce.com, a DevOps Engineer, began talking to me more about the Linux Kernel and strange behaviors in Bash.  I read a previous book to get a better understanding of the OS and am really happy that I skimmed through this book.

Kernel Book

Linux Kernel Development covers the Linux source code by going through different subsystems and explaining how it works.  It’s a deep-dive into things like: process management, memory, I/O, Virtual File System, Cacheing, Timesharing… It’s inspirational to see how much thought has gone into the Operating System and how many improvements are mentioned.  You really feel like you are standing on the shoulders of giants after reading this book.

Linux Kernel Development feels like a technical reference and I’d recommend reading a book on Operating Systems before getting too deep into it (or taking courses in C).  I skimmed through this book, because I use Linux daily and feel a bit clueless about what is happening under the covers and wanted to learn more about it.

Terraform: Up and Running by Yevgeniy Brikman:

Terraform: Up and Running covers… Terraform, the cloud provisioning software by HCL corp.  .  Terraform is a framework for deploying IT services to AWS, GCP, Azure and Digital Oceans in an automated fashion.

Terraform is cool in that you write your infrastructure as a series of templates.   These templates are in the form of a declarative language called HCL, which describes your cloud infrastructure typically in a 1-to-1 fashion with the services you have deployed.  What’s special about Terraform is that after you apply a HCL template to your cloud environment, it writes the current state into a file (immutable data structure).  Every additional change begins with your last state and modifies it.  A lot of devops systems are not aware of their previous configurations.  Terraform reminds me a little of Redux, but applied to Infrastructure instead of web development (I might be wrong).

Things I noticed from the book.  They suggested deploying these state files to S3, expect strong concurrency controls around the Terraform library and advice that you don’t mix other devops tools with Terraform.  That way if a user manual creates an account that Terraform isn’t aware of, it won’t create an error (since that manually created user isn’t part of Terraform’s state).  It seems Terraform works best as an isolated service and the “main” provisioning tool for a specific subspace of your infrastructure.

I skimmed through this book as I was interested in Terraform and have heard of a lot of adoptions in industry of this technology.  I didn’t get to test the code in this book and can’t really speak about it.

The Design of Everyday Things by Donald Norman:

The Design of Everyday Things by Donald A. Norman is a book about usability and user design.  It’s the book that I’ve been listening to on Audible, an audio book app by Amazon.com.

The book goes over the design of everyday things: ovens, doors, cars, computers, phone systems, radios and details both design flaws and positive things about different objects.  He focuses a lot on understanding differences between knowledge in the world vs in the mind, how we map controls (buttons etc) to actions and how overloading them can lead to confusion and how to constrict user settings to prevent too many options flooding the users consciousness.

He’s a big proponent of mapping controls to physical aspects of the world.  For example, a car seat control should move the seat forward if a switch is moved forward and backwards if a switch is flipped backwards.  A switch shouldn’t move forward and backwards if a button is pressed left or right as that will confuse a user.  He also favors designs were cues exist in the world that indicate what to do and where each control (button) does one and only one thing.  A button on a watch should only turn off the alarm not adjust the alarm or answer phone calls as well.  If these aspects of designs can’t be applied, he suggests standardization across an industry.  A water facet for example should have cold water knob always to the right of the hot water knob.

This is a great book.  I would suggest reading it on Kindle or as a paperback book. My big issue with Audible and Audio books in general is that I typically listen to them while walking or multi-tasking.  That means I lose focus on certain sections (last 2 chapters).  Overall, I really enjoyed the content I heard from this book.

Best,

Chris

5 lessons learned as an amateur investor

money-in-motion

1.  Money is almost always in “motion”

I often hear people talk about savings in a static manner.  I have $5,000 in the bank.  If I budget properly, I will have $6,000 next month.  Once I have $25,000, I’ll put down a downpayment on a house!

When you save, you become an economic force multiplier.  Your savings get loaned out minus some fractional reserve (typically 10%) to the banks customers.  So, if you put in $100, the bank might loan $90 to other customers and keep %10 in reserve in case bank customers decide to withdraw cash.

The recipient of the bank loan also deposits the loan into a bank.  That means:

$100 -> $90 -> $81…

If you do the math, an initial deposit of $100 leads to about $900 in loans ($1000 in money flowing in the economy).  This system works as long as all the banks customers withdraw their accounts at the same time (a run on the bank).

The bank of course charges interest on those loans and only pays a fraction back to it’s depositors.  That’s how they make money!  Which leads to…

2.  Investors see savings as a loss…except…

If you read the first chapter of Investments by Bodie, you’ll notice something odd.  Investors never compare their investments to a savings accounts?

Investor compare investment returns to U.S. Treasury Bonds or T-Bill (or it’s equivalent in the UK..etc).  Why?  U.S. government has a very low probability of defaulting, it almost always has a better return rate than a savings accounts (usually) and it can meet it’s obligations by printing money!  Let’s sample some recent T-Bill rates:

Date1 Month1 Year5 Year10 Year30 Year
June 1, 20181.742.282.742.893.04
June 4, 20181.772.32.782.943.08
June 5, 20181.822.322.762.923.07
June 6, 20181.812.322.812.973.13
June 7, 20181.782.312.772.933.08
June 8, 20181.782.32.772.933.08
June 11, 20181.822.322.82.963.1

Companies reflect a similar attitude when it concerns saving money!  They like generating cash and having it present to pay for operating expenses, but they don’t want to hoard cash for it’s own sake.  Companies typically reinvest cash in the business to create a greater return or return cash back to its shareholders when they can’t.  If a business can’t create a good return on your money (due to maybe a saturated market), it is probably best that they return the capital so that it can be employed in other opportunities.

Cash is still king! If you don’t generate cash quick enough, you will go broke!  If you don’t have cash or other liquid assets available, it’s hard to take advantage of price drops in assets (in say stocks).  Cash is prized for it’s liquidity, but represents an opportunity cost in the medium to long-term.

3.  Oh no! Inflation!

Ever hear people talk about when the price of bread was $.10?  Do you feel like the price of coffee has doubled over the last 10+ years?

Based on the CFA level 1 economics section, most governments target an inflation rate between 1-2%!  They avoid 0%, because there is a risk of deflation or negative inflation rates.  Why invest in a business, if by holding money you can buy more goods?  The opposite extreme is hyperinflation.  At 10% inflation, a $20,000 car would be worth $32,000 in 5-years and $52,000 n 10-years.  2% inflation equivalent is $22,000 and $24,200 respectively.  Having low inflation promotes investing, while preventing extreme changes in price!

How does inflation impact retirement?  If you retire in 35-years and inflation is 2%, the money in your bank will be worth 50% of it’s current value!

How do investors think about this?  They take the risk-free rate (T-Bill) and apply expected inflation to it.  This is called the nominal return rate!  They then add a premium on top of that for the risk of default, liquidity of a market and the opportunity cost of long maturities.  Investors expect investments to compensate for inflation and risk!

4.  Equity vs Liability?

I was reintroduced to the accounting equation recently:

Assets = Liabilities + Owner’s Equity

Assets is the property of a business.  Liabilities are 3rd party claims on your business: a bank loan or unfulfilled customer order.  Owner’s equity is how much value you own in your business after paying of loans and other obligations!

Investors can be part of either the liabilities or equities side of this equation!  You can either loan your money to a business or buy a claim in that business.  Giving a business or government a loan with an interest rate is called a bond.  Buying a stake or becoming a owner of a business is called stock.

Bonds:

Bonds are less risky!  When a company goes bankrupt, they have to pay off their debtors first before claiming anything left over in the business!  On the other hand, bonds have no claim on the businesses outside of interest and principal payments (for the most part).  That is, you get paid interest for a fixed number of years (or months) and then you get your loan amount back!  The business owes you nothing afterwards!

Stock:

Common Stock is a claim or slice of a business.  When a company makes makes a profit (after paying interest), it has a choice of reinvesting it into the business or paying it back to shareholders in the form of a dividend.  The attractive aspect of a business is that you get to participate in “your” growing business as a stake holder.  This is of course a double-edged sword!  If the company loses money, it will directly impact your stake in a company.  If the company goes broke, you might lose everything (that can be true of bonds too, it’s just less likely)!  Stock typically is traded in a market and company valuations (or re-evaluations) can significantly impact it’s value.

Inflation Risk:

Stocks adjust better to inflation and tend to have a better return over time (at a market valuation risk).  A business can adjust product prices for inflation!  Investments in say factory equipment or new technology should improve the companies value in the long-run.  Bonds are presented as fixed principal and interest amount (usually) and are typically impacted by inflation.  For this reason, many 401k hold stock when you are younger (to grow your fortune with companies) and add bonds as you age (to guarantee principal, while gaining a cash flow).

5.  Emotional Rollercoaster vs Long-term investing?

Stocks are traded on either a secondary market (stock exchange) or primary market (Initial Public Offering).  You can get access to through a brokerage like: TD Ameritrade, ETrade, Fidelity or Robinhood etc.  These brokerages typically offer bonds as well!

Emotional Rollercoasters:

Owning stock can be an emotional rollercoaster!

Bad news and Facebook:

One of the first stocks I bought was facebook.  It was during a controversy where Facebook was going to split it’s stock into two different classes (types).  The company had been doing good stock price-wise and I wanted to put my money into it.  Within a month, I found an academic study that treated Facebook like a flu epidemic and stated Facebook would disappear within 12 months.  Having never invested, I was super sensitive about losing all my money and decided to sell the stock!  The article trended on news outlets, but most investors were focused on the company fundamentals and so the stock price never budged.  Instead, the stock price increased exponentially that year!  It was the first lesson I had about listening too much to bad news!

Short-term Prices and Nvidia:

Similarly, I bought Nvidia as I knew that GPU (graphically processing unit) demand was increasing due to applications in AI and computer vision. They were the undisputed leaders in that sector and had outpaced their competitor AMD by a large margin.  Reports indicated that AMD would get a new chip into market, which would capture some of Nvidia’s low to mid-tier video game market, but Nvidia would cement it’s lead in high-end gaming the following quarter.  Their expansion into data centers made them an attractive choice as their revenue was expected to explode! (The reason I know this is news + 10k + reading specialists reports in that industry).

I decided to buy shares and thought I would hold them for the long run.  Sadly, my gut and emotions defeated me this time.  A report came out about a switch from hardware to software-oriented bitcoin mining that would negatively impact the short-term demand for Nvidia GPUs.  The stock dropped 10%.  My emotions got the better of me and I sold!  3 months later, I found out that Nvidia recouped the price difference and increased by another 20%.  My second lesson, if you are interested in a firm long-term, you should become less sensitive to daily price fluctuations (unless the company is going bankrupt, involved in fraud or a big assumption about growth changes…ok quiet a bit).

When you buy a single stock, you have to tolerate speculation, bad news and possibly daily price fluctuations.  You will also be surprised at what impacts the stock market as a whole (Trump tax cuts).

Note: I am not advocating either Facebook or Nvidia stock.  I’m using it to show how investment behavior changes when you own a stock!

Long-term investing:

Owning individual stock ties you to the fate of a single company.  That means you are exposed to bad news (or speculative news) as well as greater fluctuations in price.  A way around that is to own multiple companies!

ETFs

ETFs

An alternative to investing in individual companies is to invest in: ETFs (or mutual funds) and/or bonds.  Bonds I spoke about previously, but it’s worth talking about ETFs.

ETFs represent a slice of many companies (or bonds).  You can for example own a piece of the top 500 companies by investing in a S&P 500 index fund (like VOO or SPY).  The nice thing about ETFs is that they buy stock in bulk by pooling capital from many investors.  They then create slices from the fund that are significantly cheaper than buying each individual stock separately.

In our example, if the average cost of a stock was $20, you’d need $10,000 to purchase each stock (as an individual investor).  An ETF gets around this $10,000 cash requirement by collecting say $100 from 100 investors and then giving each ETF holder a single share representing a 1% stake in those 500 shares!

ETF diversification

Why would having a 1% stake in 500 companies be worthwhile?  First, those 500 companies might operate in different sectors of the economy.  One company might be a retail giant, while another represents a utility company.  If the retail giant competes with amazon and begins losing customers it’s stock price might decrease.  This decrease in stock price probably won’t impact utility industry!  So the loss from the retail giant might be offset by an unrelated price increase from the utility company!  Of course, this works against you as well!  If a company is doing really well, it might be offset by a failing industry!  Overall, a well-diversified ETF tends to have more stable daily price fluctuations with fewer large dips or huge gains (well-diversified part is key).  This is why ETFs and mutual funds (a similar concept) are often used by investors that don’t want to actively manage their investments (known as passive investors).

Since you rarely know all 500 companies in an ETF, you tend to be less impacted by bad news or price fluctuations (due to diversification) compared to owning a single stock.

ETF interesting notes

Some other interesting notes about ETFs.  ETFs often have a dividend.  Dividends are cash paid back to an investor for holding onto the stock for a set amount of time (typically represented as a % of the stocks value).  Dividends can often be reinvested into ETFs at a fractional rate (this is called a DRIP – Dividend reinvestment program).  ETFs often have a management fee, which can be anywhere from .02% to 2%+ of the investment value.  This management fee is typically taken out of the stocks gains or principal.  ETFs can also be leveraged meaning the fund takes loans out to buy more stock (at interest rate) or have higher turnover which means that it trades stock more often increasing trading fees. You  typically have to read the prospectus, a document explaining the fund, to see if it is leveraged or has a high turnover rate (sometimes not mentioned).


ETFs compared to 401k/IRA

Have you ever wondered how stocks/bonds relate to your 401k and IRA.  Many 401k funds are composed of a mix of Stocks and Bonds.  Stocks tend to be split between domestic and International stock (at least in the US).  Younger individuals or those that elect a more aggressive portfolio will have more stock and international stock in their fund!  Stock is an equity position that tends to perform well over long time frames.

Older individuals will see more of their portfolio dedicated to bonds.  This is due to the fact that bonds, a liability position, tend to be safer in the short and medium term.  Remember bonds are loans that aren’t directly attached to the valuation of the company and get paid out first when a company goes bankrupt.  Bonds, however, tend to be more sensitive to inflation in the long run (unless it’s an inflation protected bond).

Many retirement funds behave similar to ETFs or mutual funds, because they are a diversified positions.  One major difference between the typical ETF and retirement fund is that ETFs tend to be more specific (often less diversified) to an industry, country or the economy.  They also tend to be less diverse in terms of types of investments. A retirement fund will often have bonds, stocks, international stocks and possibly CDs.  An ETF tends to focus on only one of those (an ETF focusing on bonds is called a bond fund).

Another difference, retirement funds have government sanctioned tax advantages.  In return for the tax shelter, you are not allowed to withdraw from your 401k or IRA until retirement age (or risk a 10% penalty).

Summary

I’m still relatively new to the stock market and trading.  I’ve gained some confidence over time by reading more about the topic and trying to put a little extra money into my brokerage!  Hopefully the article is useful for other beginning traders or people interested in how the stock market works!


HBX Core – Harvard Business Schools Extension Program

HBX Students

Introduction:

Harvard Business school runs HBX – Core, an online business learning platform.  HBX Core is composed of 3 classes: Accounting, Statistics and Economics for Managers all targeted at improving your business understanding and becoming a better manager.  Once you complete all 3 courses, you get the: credential of readiness.  What does the course cover?

Financial Accounting:

The course covers accounting transactions, financial statements and some basic financial analysis/forecasting.  It covers some accounting principles as well (historical pricing, consistency..).  It’s a great course if you want to understand accounting basics.  The instructor uses real life examples in his course including Cardullo’s located in Cambridge, Ma next to Harvard as well as Bikram Yoga, a yoga study in Natick, Ma.

Statistics (Business Analytics)

This course covers descriptive statistics: mean, median and mode, hypothesis testing, confidence intervals and regression (both single and multiple).  This is similar to an 1st or 2nd class in statistics.  It’s in my opinion a bit more intuitive in it’s explanations than the course I took in college.  One highlight of the course is it’s emphasis on statistic calculations n Excel, which are mostly single formula based.

Economics for Managers

This is an economics course that focuses almost exclusively on microeconomics.  The class can be evenly split into two parts: demand vs supply with the last portion emphasizing the intersection (market).  This course is cool in that all the examples are really intuitive.  You will explore demand curves by answering polls, supply curves by looking at the entire aluminum industry in an interactive graph, price wars by using financial statements and short vs long term markets by looking at the short/long term demand for lawyers.  This course also covers alternative distribution methods such as queues, the formation of secondary markets during a price ceiling, different types of auctions and the two-tariff price model (subscriptions that lower the average price charged per unit).  I liked this course the best.

HBX Courses

Alternative

Something very similar in nature to the above program, but requiring significantly more time: CFA level 1.  CFA level 1 is 1 of 3 exams to become a Chartered Financial Analyst, a designation valued in the investor industry.  It covers ethics around investing, statistics focused on investments, financial statements, micro and macro economics (focus on interest rates and monetary policy).  The section dedicated to finance is twice as long as all the other sections combined.

Summary

Overall, it’s a descent program if you are interested in learning business fundamentals.  It’s also reasonably priced ($1950) and offered by a credentialed university (Harvard), which means you can expense it under most firms education reimbursement policy.


Guns, Germs and Cancer

Introduction

I’ve been shocked lately by mortality statistics.  My grim inspiration being a combination of: talking to my sister about gun violence statistics, reading a book on financial planning and helping a good friend out with a legal retirement issue (I ran simulations of his death 100 millions of times, fun!).  The most shocking thing what age are 50% of people dead by (both men and women).  This is best seen in this social security – actuarial life table:

Social Security – Acturial Life Tables

On average:

  1. 50% of men survive past age 80.
  2. 50% of women survive past age 84.

Don’t want to look at raw data (I don’t blame you).  Here is an awesome data visualization that I take no credit for at all:

Note that like the actuarial tables, the odds of dying rapidly increase with age!

Every Single Death?

Did you realize the CDC has all 2.6 million or so deaths (per year) recorded in a database?  The data is anonymized!  Just in case you were worried!

  1. CDC Wonder (US deaths): https://wonder.cdc.gov/cmf-ICD10.html
  2. Kaggle (CDC Wonder Extract): https://www.kaggle.com/cdc/mortality/data

I ended up running death statistics by age in a IPython notebook with my currently limited (but improving) understanding of Pandas.  Interestingly enough, I got approximately the same numbers (tallying all death counts).  If you want to do you own analysis, use Kaggle data set.

As someone in their early 30s, I had no sense of aging at all.  Instead, I’m constantly thinking about beautiful places to go on vacation or what to explore in the city (Boston).  Let’s add vacation and Boston photos to cheer the article up:

Image result for Bahamas

Bahamas – Somewhere Beautiful

Image result for Top of the Hub

Top of the Hub!

Anyway, back to the statistics aspect!  What’s another cool factoid we could discuss!

Gun Suicides (note not homicides)

I understand that the buzz in media is to implement gun control to prevent violent homicides.  Did you know that around twice as many people die in gun-related suicide events?  I wasn’t aware of this problem until my sister mentioned it!  Two graphs in Vox really spoke to me:

Link: Vox 17 Charts on America’s unique gun violence problem

I don’t want to get too deep into gun control (the news covers it well enough), but I do find it interesting that no one in the media talks about what seems to be a huge issue!  Something that claims 2 times the number of lives as gun homicide involving the exact same weapons (guns are involved in 50% of suicides)!

Just to provide a second source, here is a wikipedia chart:


Homicides, what actually happens!

If you read a little more on the wikipedia article, you can find some interesting information.  For example, only 1% of gun homicide involves mass shootings (often shown on televisions) quote from wikipedia:

Deadly mass shootings have resulted in considerable coverage by the media. These shootings have represented 1% of all deaths using gun between 1980 and 2008.[116] Although mass shootings have been covered extensively in the media, mass shootings account for a small fraction of gun-related deaths[17] and the frequency of these events had steadily declined between 1994 and 2007. Between 2007 and 2013, the rate of active shooter incidents per year in the US has increased.

When I think about mass shootings, it usually involves a child who got an AR-15 and decided to vent his anger on the student body.  What does the typical homicide look like?  It happens that 75% of these homicides are caused by handguns.  Shotguns and assault rifles only account for about 9% of gun-based homicides:

According to the FBI, in 2014, there were 8,124 total firearm-related homicides in the US, with 5,562 of those attributed to handguns.[8] The Centers for Disease Control reports that there were 11,078 firearm-related homicides in the U.S. in 2010.[10] The FBI breaks down the gun-related homicides in 2010 by weapon: 6,009 involved a handgun, 358 involved a rifle, and 1,939 involved an unspecified type of firearm.[11] In 2005, 75% of the 10,100 homicides committed using firearms in the U.S. were committed using handguns, compared to 4% with rifles, 5% with shotguns, and the rest with unspecified firearms.[75]

I am not in any way making an opinion about outlawing assault rifles.  Instead, I’m looking at the data and coming to the conclusion that handgun related deaths are much more common (draw any conclusion from that):

Homicides, the perpetrators!

Another interesting chart on wikipedia is the homicide by offenders age.  The clear outlier here is the age group: 18-24 with 14-17 year olds being more prominent in the 1990s.  25-34 year old range seem to swap places with 14-17 year olds around 2000 becoming the second most violent group!  Alright, we understand the perpetrators, but what about the victims?

Homicides: Victims!

How common is it to die from homicide (all) and let’s bring in suicide as well!  This CDC paper had some really great charts in it:

National Vital Statistics Reports

It’s not big enough of a problem to be listed as a top 10 leading cause of death in the US (suicide is a top 10 killer for men: 2.5%).  The more interesting part comes when you break it down by age group:

It ends up that suicide and then homicide are responsible for significant percent of deaths between 1-44 and taper off at around age 45 when other diseases become more prevalent.

With such huge percents, you would think that suicide and homicide would be top topics for our society.  The above pie charts misinterprets the amount of deaths.  The odds of dying young are rare!  Only 5% of people die before the age of 45.  That’s less than 200,000 of 2.6 million deaths.  Overall around 10,000 of 2.6 million deaths are associated with gun homicides: .4% of US deaths (all homicides are around .6% of all US deaths).

Gun-related Deaths: The Devil is in the Details!

Data can tell sad stories.  Three of those stories involve: men, old white men and young black men.  An article in fivethirtyeight.com provides the data visualization below (click to interact with it yourself):

85% of gun-related deaths involve male victims.  Men are 6 times more likely to die from guns than women.  Within the male only group, two groups of victims stand out: old white men and young black men.

If you take all male deaths in the aggregate, 18.5 men die have a gun-related death per 100,000 men.  When you sub-divide this, we find that 11.7 men committed suicide and 6.4 died in homicide per 100,000 men.  The rest of the deaths .4 were related to accidents or could not be determined.  Comparatively, The aggregate statistic for women is 3.0 gun-related deaths per 100,000 women.

Within the suicide statistics, white males are 3-5 times more likely to commit suicide than any other male only racial group.  These odds increase with age.  At ages 15-34, the suicide rate is 13.4 per 100,000 white men.  That jumps to: 19.7 for white men aged 35-65 and a startling 28.2 for white men over 65 years of age.  Black men, the next highest racial group only had 5.3 suicides per 100,000 black men.  A factor of 5 less.

Young black between 15-34 males have the highest incidence of homicide: 73.5 homicides per 100,000.  That’s a factor of 5 higher than 15-34 year old male group: 14.8 homicides per 100,000 and a factor of 10 higher than all males combined: 6.4 homicides per 100,000 men.  Homicides decrease with age.   Black men 35-65 having: 21 homicides per 100,000 and those older than 65 years: 3.4 homicides per 100,000.

Sense of Scale:

Like most things in life, I often have no sense of scale.    I know for example that around 50% of deaths are caused by Cancer and Heart Attacks.  I have no clue how that varies by age.  The below graphic was really interesting, click to access the interactive variant (provided by flowing data.com):

Scale!

Another cool version of the above data is a simulation done by Flowing Data, click to access the interactive article:

My big conclusion on this is that most deaths are related to age-related/life style disease!  That definitely explains the average life expectancy is in the late 70s and 80s.

Summary:

What is the most important conclusion I got out of this?  Mass shootings with assault rifles is a very rare incident.  That doesn’t make it any less tragic.  On the other hand, homicides with handguns are significantly more common.  Homicides involve a handgun 75% of the time.  The perpetrators and victims are typically under the age of 45 and these deaths represent .4% of all US deaths in a given year.

Only 1 in 20 people die before the age of 45.  The great killers are lifestyle and age-related diseases that become more common after the age of 60.  The amount of deaths increases drastically over time (actuarial tables).  Two diseases: heart attack and cancer account for 50% or around 1.2 to 1.3 million deaths a year.  That’s a staggering number compared to both suicides (around 40,000) and gun-related homicides (around 10,000).  That is, you are 120 times more likely to die of heart attack or cancer than violent gun homicide.

What are your thoughts on the topic?  How do you think scale of the problem should influence public policy?  Do you think we should view mortality rates differently based on age brackets?  How does the media influence on perception of death?  I tried to make this as apolitical as possible so that the data speaks for itself.

Any great data visualizations or research on the topic?

Sources:

Most of the data was derived from the CDC and wikipedia!

Now, for a bit of happiness to improve everyone’s mood (distract from the morbid topic).  Here is a kitten hanging out!

Data Camp: Week Adventure into Python Data Science

Image result for data camp

Introduction:

Noah, a former TechTarget colleague, mentioned  datacamp.com  to me, while we were discussing an issue with remotely hosted files (probably rdp associated) and pandas DataFrames.  On February 10th, I decided to give it a try and today, 6 days later, I finished up the Python Programmer Track (10 classes)!

What is Data Camp?  Data Camp is an online education company that offers data science specific courses.  They focus mostly on two lines of technology: R and Python.  They offer some auxiliary courses in other topics: SQL, Linux and git (as well as a few derivatives).  All the courses are hosted on their online platform, which overall is beautiful to interact with.  A bit more about the topics:

Data Camp Topics:

R – Statistical Programming Language

A statistical programming language inspired by LISP and developed by professors at the University of Auckland.  R has become famous amongst statistics and machine learning researchers where they prototype cutting-edge research and provide it as packages to CRAN, a online index for hosting R code.

Python – General Purpose Language

A general purpose programming language developed by Guido van Rossum.  It’s a dynamically typed, interpreted language that has been used for rapid prototyping and scripting.  Python as a general purpose programming language that can be used for: web development, networking, devops, data analysis and machine learning.  Python has gained popularity over the last few years with increased interest in it’s scientific computing platform.  Pandas, a popular Data Science framework, was inspired by R’s data frame.

SQL – Structured Query Language

Structured Query Language, SQL, is a domain-specific language typically associated with relational database management systems (RDBMS aka SQL databases), but has been coopted by other solutions (BI platforms, Hadoop and Spark).  SQL is easy to learn and revolves around a few common entities: Servers, Databases and Tables (Views etc).  Tables can be viewed as tabular data where rows are entities (employee) and columns are attributes of the entity (salary).  Most SQL is used to retrieve data hosted in tables mediated by RDBMS.

Context

R and Python are used to manipulate data in a procedural way, typically through the use of things like Data Frames (R), Pandas (Python) or Numpy (Python).  These libraries create tabular, matrix, vector or scalar data often rely on vectorized operations to do computation.  Both R and Python have extensive data visualization frameworks to create graphs.  They also have great libraries for statistics, machine learning and artificial intelligence.  SQL is primary associated with data retrieval and is used to get “data” back from a hard drive (through the database).  Most database are more limited in functionality when it concerns more finite data manipulation, graphing and machine learning (though extensions do exist).  They make up for it by being able to store large quantities of data without relying extensively on memory (volatile and limited).  Generally, most software engineers and analysts use both a programming language like (R/Python) and SQL (to access data).

Data Camp:

Summary:

Data Camp breaks down Python/R courses on career tracks: Python Programmer, Data Analyst and Data Scientist.  Each track is composed of a number of courses: 10, 13 and 20 respectively.  Topics covered: basic programming, data manipulation techniques, graphing, statistics, machine learning, network analysis and ai (1 course).

Each course is composed of 3-5 segments.  Each segment has a set of lectures followed by exercises.  You can expect around 3 lectures and 10 exercises per segment.  Most courses build on themselves intuitively beginning with the basics and gradually building up in complexity.  I was surprised to find lectures on generators, closures and how they relate to data frames within the first 4 classes.

Lectures:

datacamp lecture

Lecture portion of the website is beautiful.  Presentations have nice transitions and the website background is not distracting.  Lecturers were clear and easy to follow.  You get a sense that al to of effort was put into the curriculum.  There were multiple lecturers in the 10 courses I took (around 5-6).  Some of these lecturers work for esteemed companies like Anaconda, published books on the topic they spoke on or had a background in software engineering/consulting.  Overall, the lectures were high quality with very few mistakes.

Practice Sets:

datacamp practice problems.

The practice problems were conducted in what looks like a modified ipython notebook embedded in the website.  They have 4 panels, the 2 on the left: exercise and instructions and 2 on the right: Scrapt.py and ipython Shell.

The exercise and instructions provide guidance on how to complete the exercise.  The Exercise section explains the topic.  The instructions tell you what steps need to be completed before submission is excepted.

Script.py is where you write your code.  The run code button let’s you execute script.py and see the output in the IPYTHON SHELL.  It’s pretty interactive.  When you submit answer, it checks if the solution matches the instruction section.  For the most part, there are few cases where code I submitted was marked wrong when it was in fact right.  That’s great!

What if you get stuck on a programming problem?  There is a button called hint.  This provides some extra guidance typically in the form of small chunks of code.  If you press the hint button, a new button called show solution will appear.  Clicking the show solution button will overwrite the SCRIPT.PY window with the correct solution, which you can then run and submit.

In rare occasions, you might end up with a multiple choice question.  They offer an interactive shell in this case.  It always proceeds the more free-form question variant.

Gamification:

Data Camp has one really great feature that I liked.  Each exercise has an amount of xp that you can collect.  Each lecture is worth 50xp, multiple choice is worth 50xp and problem sets are worth 100xp.  If you click the show hint button, the problem set xp is reduced to 70xp.  Show solution gives you 0xp.  When logging in, you will see the total xp you got that day as well as how many days in a row you have utilized data camp (streak). This is a great way to motivate you to do the exercises.

Another layer of gamification comes from certificates you can collect (and post on linkedin) as well as career tracks you can complete.

Cost/Summary:

I think data camp is very friendly to beginners interested in learning about data analysis in Python and R, both marketable skills.  I think the course layouts, lectures and practice problems are well thought out.  I would suggest that beginners also read books and online documentation on subjects like Pandas and Numpy.  I found data camp focused more on practicing skills and less on implementation details (which is a good thing).

Data Camp is currently on sale for $180/year (usually $300/year).  You can also buy it as a monthly subscription for $30/month.  Data Camp is similar to Udemy.  There are 3 advantages Data Camp has over Udemy:

  1. Practice problems make up a larger percent of the curriculum.
  2. $30/month you have access to any one of 100+ courses.  The Udemy equivalent is $15/course.  A Udemy course is equivalent to 3 Data Camp courses (in material)
  3. Data Camp specializes in data science and has really thought about how to naturally progress through the data science material.
  4. If you like structured programs, this is better.

Advantages of Udemy:

  1. Overall larger selection of content, variety and topics.  If you want to practice Python, but want to tackle multiple topics like: web programming, networking, penetration testing or a specific subset of machine learning.  It might be a better option.
  2. There is no subscription fee.  It’s fixed cost.  If you are not sure you want to invest a lot of time into python programming this is a better choice.
  3. Lectures are not as uniform.  You might find some lectures that are more theoretical.  Others are more practical.  That means you can try out different lecture styles to see what works.

Best,

Chris